As young people get older and take part in more independent travel, the risk of involvement in road crashes increases.
In this lesson, students use crash fatality data to create different data displays, calculate the mode, median and mean of crash data for different ages of children and young people, and describe and interpret their findings to explain which age groups have been more involved in fatal crashes in Victoria.
This activity supports:
- Data representation and interpretation
- Identify and investigate issues involving numerical data collected from primary and secondary sources (VCMSP268)
- Construct and compare a range of data displays including stem-and-leaf plots and dot plots (VCMSP269)
- Calculate mean, median, mode and range for sets of data. Interpret these statistics in the context of data (VCMSP270)
- Describe and interpret data displays using median, mean and range (VCMSP271)
Download the lesson plan in the link above, and access the supporting spreadsheet resource for this lesson plan below:
Recommended Resources
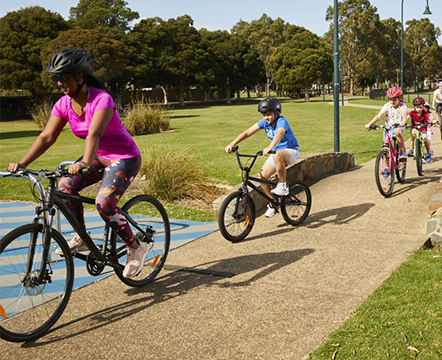
Bike Ed
The Bike Ed program is a program that gives children and adults the opportunity to learn about safe riding behaviours; road rules and riding in a shared environment.
Bike Ed
The Bike Ed program is a program that gives children and adults the opportunity to learn about safe riding behaviours; road rules and riding in a shared environment.
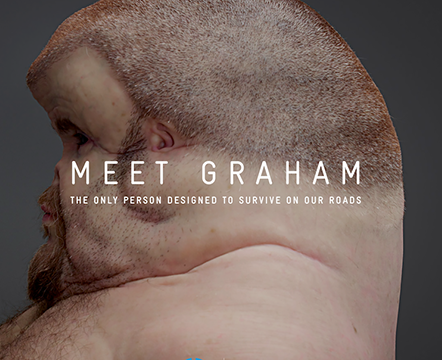
Meet Graham
Graham is a lifelike figure depicting what we might look like if we were built to survive on our roads.
Meet Graham
Graham is a lifelike figure depicting what we might look like if we were built to survive on our roads.

Road Safety Risks for Young People
In this lesson, students investigate the key road safety risks for young people.
Road Safety Risks for Young People
In this lesson, students investigate the key road safety risks for young people.

Importance of Bicycle Helmets
In this lesson, students investigate how bike helmets protect a cyclist’s head in a crash.
Importance of Bicycle Helmets
In this lesson, students investigate how bike helmets protect a cyclist’s head in a crash.

Road to Zero: Road Safety Education Experience
Road to Zero is a world first road safety education centre.
Road to Zero: Road Safety Education Experience
Road to Zero is a world first road safety education centre.
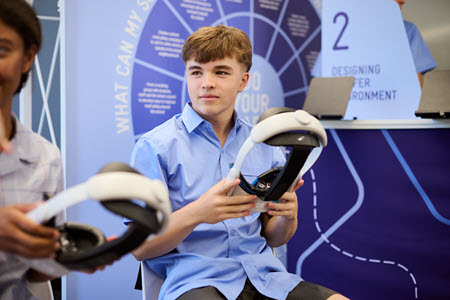
Road Smart Interactive
Road Smart Interactive is a new, evidence based, highly interactive road safety education program.
Road Smart Interactive
Road Smart Interactive is a new, evidence based, highly interactive road safety education program.